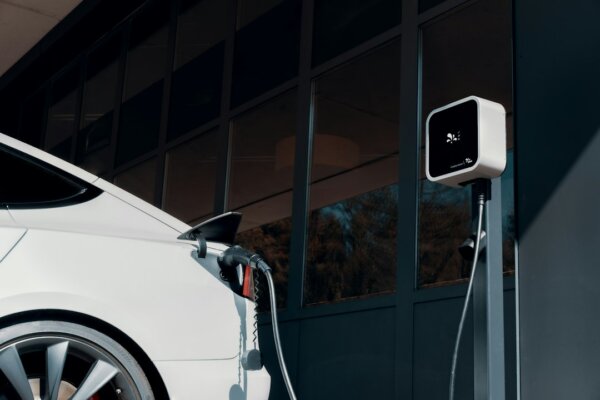
Photo by Maxim Hopman on Unsplash
When Wall Street replaced the decade-old “FAANG” acronym with the “Magnificent Seven,” it grouped seven mega-cap corporations under a single presumption: that each company commands durable software monopolies, high profit margins, and relentless secular growth. Yet financial filings through November 2026 show that the Tesla Magnificent Seven valuation rests on assumptions disconnected from the company’s operating reality. While peers like Microsoft, Alphabet, and Meta generate operating margins above 25% and consistent double-digit earnings growth, Tesla’s net income plummeted by nearly 75% between fiscal 2023 and fiscal 2025.
Tesla trades at a trailing price-to-earnings multiple exceeding 140, according to MarketBeat data as of November 19, 2026, even as its annual vehicle revenue stagnates and automotive margins compress under aggressive global price cuts. Treating Tesla as an interchangeable software-and-cloud peer alongside Nvidia or Apple masks significant fundamental divergences. For institutional allocators and retail index investors alike, the Magnificent Seven moniker has obscured an underlying reality: Tesla is an automotive manufacturer carrying industrial cyclicality, not an asset-light technology platform.
- Revenue Stagnation: According to SEC Form 10-K reports compiled by Visual Capitalist in March 2025, Tesla generated $97.7 billion in fiscal 2024 revenue, representing 1% annual growth, while Nvidia grew 114% and Meta expanded 22%.
- Earnings Contraction: Tesla SEC Form 10-K filings reveal net income attributable to common stockholders fell from $14.99 billion in fiscal 2023 to $7.09 billion in 2024, and dropped further to $3.79 billion in 2025.
- Valuation Disconnect: As of November 19, 2026, MarketBeat records Tesla’s trailing price-to-earnings (P/E) ratio at 142.72, compared to 38.95 for Apple, 22.47 for Microsoft, and 16.48 for Meta.
- Margin Deterioration: According to Macrotrends data, Tesla’s operating margin stood at 3.35% for the quarter ending September 30, 2026, compared to an average net margin of 25.8% across the Magnificent Seven reported by LSEG.
From FAANG to the Magnificent Seven: How the Narrative Shifted
For nearly a decade, the benchmark for large-cap tech leadership was FAANG: Facebook (now Meta), Apple, Amazon, Netflix, and Google (Alphabet). Coined in 2013, the grouping reflected consumer-facing platforms that benefited from network effects, zero marginal distribution costs, and high returns on invested capital. These companies required minimal physical factories relative to their revenue output, insulating them from traditional industrial overhead.
By 2023, market strategists retired FAANG in favor of the “Magnificent Seven,” removing Netflix and adding Microsoft, Nvidia, and Tesla. The rationale seemed compelling at the time: all seven were perceived as dominant forces driving artificial intelligence, autonomous infrastructure, and the post-pandemic digital economy. By late 2023, the group accounted for roughly 28% of the S&P 500’s total weighting and generated approximately 73% of the broad index’s annual gains, according to CMC Markets and Applied Finance reports.
However, the inclusion of Tesla papered over a structural flaw in the acronym’s logic. Microsoft, Nvidia, Alphabet, and Meta own proprietary software stacks and data center ecosystems that command pricing power. In contrast, Tesla sells manufactured goods subject to physical wear, capital depreciation, assembly logistics, and supply chain shocks. When interest rates rose and electric vehicle demand slowed, the distinction became impossible to ignore [INTERNAL LINK: mega-cap tech earnings].
Tesla Magnificent Seven Valuation: The Fundamentals Mismatch
The core justification for any mega-cap tech multiple is operating leverage—the ability to grow revenue and expand profits faster than operating costs. Across the Magnificent Seven, six members continue to prove that leverage. Tesla, however, has experienced the opposite dynamic: declining earnings power coupled with stagnant top-line expansion.
Data from company 10-K filings compiled by Visual Capitalist highlights the divergence in top-line growth across the cohort during fiscal 2024:
| Company | Annual Revenue | YoY Revenue Growth (FY2024) | Primary Business Model |
|---|---|---|---|
| Nvidia | $130.5B | 114% | Semiconductor Hardware & Software |
| Meta Platforms | $164.5B | 22% | Digital Advertising & Platforms |
| Microsoft | $245.0B | 16% | Cloud Infrastructure & Enterprise Software |
| Alphabet | $350.0B | 14% | Search, Advertising & Cloud |
| Amazon | $638.0B | 11% | E-Commerce, Cloud (AWS) & Advertising |
| Apple | $391.0B | 2% | Consumer Hardware & Services |
| Tesla | $97.7B | 1% | Automotive & Clean Energy |
According to Visual Capitalist’s filing analysis, Tesla posted just 1% top-line growth in 2024, down from 19% in 2023. Macrotrends and SEC financial records show that in fiscal 2025, Tesla’s full-year revenue dropped by 2.93% to $94.83 billion.
The bottom-line contraction is even more pronounced. Tesla’s multi-year earnings trajectory demonstrates significant margin compression rather than the compounding profits expected of a premier growth stock:
| Metric (Tesla SEC Filings) | FY 2023 | FY 2024 | FY 2025 | TTM (as of Q3 2026) |
|---|---|---|---|---|
| Total Revenue | $96.77B | $97.69B | $94.83B | $103.57B |
| Operating Income | $8.89B | $7.08B | $4.36B | $3.13B |
| Net Income | $14.99B | $7.09B | $3.79B | $3.22B |
| Diluted EPS | $4.30 | $2.04 | $1.08 | $0.91 |
| Operating Margin | 9.2% | 7.2% | 4.6% | 3.35% |
According to SEC Forms 10-K and 10-Q compiled by Stock Analysis and Bullfincher, Tesla’s net income fell 52.6% in 2024 and an additional 46.5% in 2025. By the close of the third quarter of 2026, diluted EPS over the trailing twelve months had slipped to $0.91. In Business Insider reporting from October 21, 2026, Tesla’s third-quarter operating income fell 56% year-over-year to $718 million.
Despite this multi-year earnings decline, Tesla commands a valuation multiple far higher than the most profitable software giants on earth. As of November 19, 2026, MarketBeat data illustrates the extreme valuation disparity:
| Company | Trailing P/E Ratio | Diluted EPS | Net Profit Margin |
|---|---|---|---|
| Meta Platforms | 16.48 | $36.18 | 25.8% (Group Avg) |
| Microsoft | 22.47 | $22.18 | 30%+ (Enterprise Tech) |
| Nvidia | 32.91 | $4.44 | 70%+ (Gross Margin) |
| Apple | 38.95 | $8.97 | 27.60% |
| Tesla | 142.72 | $2.62 | 3.11% |
Statista analyst Felix Richter noted in February 2026 that while Nvidia operates with gross margins exceeding 70% and forward P/E around 22, Tesla stands as an obvious outlier with declining revenue and an earnings multiple that defies conventional sector valuation. In Macrotrends tracking as of November 18, 2026, Tesla’s trailing price-to-earnings ratio registered at 520.70 based on trailing GAAP net profit.
Hardware Automaker Economics vs. Platform Monopolies
The fundamental flaw of bundling Tesla into the Magnificent Seven lies in corporate mechanics. An analysis of Tesla’s 2024 Form 10-K reveals that automotive sales and leasing accounted for 79% of total company revenue, with automotive regulatory credits contributing additional high-margin revenue. Energy generation and storage accounted for roughly $10 billion, or roughly 10% of revenue.
Tesla remains, by every objective financial standard, a capital-intensive manufacturing business. When competitors in China and legacy automakers expanded EV offerings, Tesla was forced to cut average selling prices. According to Statista research published in July 2026, Tesla’s automotive revenue per delivery fell from more than $50,000 in 2021 to below $43,000 by 2026. Automotive gross margins excluding regulatory credits, which stood near 30% in early 2022, sank to 16.3% in the second quarter of 2026.
In contrast, platform monopolies possess deep moats:
- Alphabet and Meta auction ad inventory with negligible variable cost per additional impression.
- Microsoft licenses operating systems and cloud capacity that renew automatically on enterprise contracts.
- Nvidia sells high-margin data center silicon to Big Tech firms that spent an estimated $412 billion on capital expenditures in 2025 alone, according to Federal Reserve Board data cited by Quartz.
Posts on Reddit forums such as r/investingforbeginners and r/wallstreetbets describe growing frustration among retail investors, with users noting that while Big Tech peers consistently expand cash piles, Tesla’s profitability has been crushed by ongoing discounting and vehicle financing incentives. While unverified retail sentiment reflects social commentary rather than formal market consensus, it mirrors Wall Street’s numbers: Tesla cannot escape the economic reality of auto factories, heavy tooling costs, and cyclical consumer demand.
Impact on Investors, Portfolios, and Tech Workers
The miscategorization of Tesla creates tangible risks across three primary groups:
1. Passive S&P 500 and ETF Investors: Because major index funds are market-cap weighted, investors purchasing broad market indexes or mega-cap tech funds are heavily exposed to Tesla’s extreme valuation multiple. A contraction of Tesla’s P/E multiple from 140x to a standard automotive tier (10x–20x) would erase hundreds of billions in market value, dragging on index performance regardless of how well cloud software performs.
2. Quality Growth Stock Allocators: Grouping Tesla alongside Microsoft and Alphabet penalizes truly defensive, cash-generative technology stocks. Capital allocated to Tesla under the “tech giant” umbrella starves other high-performing, lower-multiple enterprise technology companies of fair index weighting.
3. Tech Professionals and Equity Compensation: Software engineers and IT professionals evaluating job offers frequently weigh restricted stock units (RSUs). While Big Tech software firms continue to generate consistent free cash flow per employee, hardware manufacturers facing margin pressure are often forced into restructuring and headcount management. Evaluating Tesla RSUs against Alphabet or Microsoft RSUs under the generic “Big Tech” banner ignores significant balance sheet risk.
Bottom Line: Recalibrating What Counts as Mega-Cap Tech
The “Magnificent Seven” was an effective marketing term for Wall Street trading desks in 2023, but financial data through late 2026 demonstrates that the classification has broken down. Tesla’s revenue growth has flattened toward low single digits, its net income has shrunk 75% in two years, and its operating margin has fallen below 4%.
Our read: Tesla should be analyzed and valued on its actual operating merits—as a leading electric vehicle and energy hardware manufacturer navigating brutal global competition—rather than an untouchable Big Tech software monopoly. Until Tesla’s autonomous software or robotics achieve tangible, high-margin commercial revenue, bundling TSLA with Nvidia, Microsoft, Apple, Alphabet, Amazon, and Meta does a disservice to fundamental analysis.
This article is for information only and is not investment advice.
Sources
- MarketBeat: Compare Magnificent Seven Stocks (November 19, 2026) [CONFIRMED]
- Macrotrends: Tesla PE Ratio and Operating Margins 2012-2026 (November 18, 2026) [CONFIRMED]
- Tesla, Inc.: Annual Report on Form 10-K for the Year Ended December 31, 2024 (January 29, 2025) [CONFIRMED]
- Visual Capitalist: Visualizing the Magnificent Seven’s Revenue Growth in 2024 (March 17, 2025) [CONFIRMED]
- LSEG: Magnificent-7 Q4 2024 Earnings Review (March 17, 2025) [CONFIRMED]
- Statista: Chart: Is Nvidia’s Stock a Bargain for Investors? (February 26, 2026) [CONFIRMED]
- Business Insider: Tesla’s Profits Are Under Pressure (October 21, 2026) [CONFIRMED]
- Reddit discussion on Tesla SEC filings and profitability compression (unverified) [UNVERIFIED]